Monitoring System
Overview
Zigbee2mqtt is an open-source project that enables the interconnection of different-brand devices with Zigbee connectivity. It can also be integrated with Home Assistant thanks to the bidirectional message relay from the network to MQTT. Because neither our Raspberry Pi nor our laptop has a ZigBee interface, we additionally need a zigbee adapter, this is the zig-a-zig-ah! (zzh!).
Ingredients
In order to follow this recipe you will need:
- A suported Zigbee adapter (zzh!).
- One or more suported Zigbee device/s.
- A Raspberry Pi 4 or RPi4.
- The
shapes-monitoring-servicedebian package, which will configure ZigBee2MQTT, Mosquitto, InfluxDB, Telegraf and Grafana, available in ARCO package repository. - Grafana APT repository, the latest OSS release, available in download link.
Configuring zzh!
Drivers for CH341
First step in getting the zzh! set up is to ensure that the host computer has the right drivers for the CH341 installed. Plug your device and ensure that zzh is detected with the command dmesg. If detected, you will see something like:
[ 2514.373835] usbcore: registered new interface driver ch341
[ 2514.373867] usbserial: USB Serial support registered for ch341-uart
[ 2514.373903] ch341 1-1:1.0: ch341-uart converter detected
[ 2514.374745] usb 1-1: ch341-uart converter now attached to ttyUSB0
Download cc2538-bsl
To run cc2538-bsl.py you need to have python3 and pip3 installed on your system. If you don’t have them installed running the following commands should work: sudo apt update && sudo apt-get install python3-pip
To download and extract cc2538-bsl run wget -O cc2538-bsl.zip https://codeload.github.com/JelmerT/cc2538-bsl/zip/master && unzip cc2538-bsl.zip in your terminal and to install the required dependencies run sudo pip3 install pyserial intelhex.
Configuring ZigBee2MQTT
Download the Z-Stack coordinator firmware from https://github.com/Koenkk/Z-Stack-firmware. The firmware you need can be found under coordinator/Z-Stack_3.x.0/bin/CC26X2R_coordinator_<date>.zip. Download and extract this.
To burn this on your zzh! go to the directory cc2538-bsl-master and run:
pi@raspberrypi:~$ ./cc2538-bsl.py -p /dev/<port> -evw <firmware_zigbee>.hex
The port, in my case, is ttyUSB0, as shown in section Drivers for CH341, so do not forget to verify the port you are using on your machine and change it, accordingly, if needed.
In case you want to erase the flash, run:
pi@raspberrypi:~$ ./cc2538-bsl.py -p /dev/<port> -e
Warning! Before running, all you have to do is to look if your port is different from ttyUSB0, in this case you have to change it in the docker-compose.yml file in the /etc/compose directory.
Configuring shapes-monitoring-service
The monitoring system, or shapes-monitoring-service, is a service running always in our device with systemd, we can see its status with the following command:
pi@raspberrypi:~$ systemctl status shapes-monitoring.service
● shapes-monitoring.service - Service for monitoring smart sensors
     Loaded: loaded (/lib/systemd/system/shapes-monitoring.service; enabled; vendor preset: enabled)
     Active: active (exited) since Thu 2021-05-13 10:55:14 CEST; 21min ago
    Process: 20484 ExecStart=/usr/bin/docker-compose up -d (code=exited, status=0/SUCCESS)
   Main PID: 20484 (code=exited, status=0/SUCCESS)

may 13 10:54:56 maria-GP63-Leopard-8RD systemd[1]: Starting Service for monitoring smart sensors...
may 13 10:54:56 maria-GP63-Leopard-8RD docker-compose[20484]: Creating network "compose_default" with the default driver
may 13 10:54:56 maria-GP63-Leopard-8RD docker-compose[20484]: Creating mosquitto ...
may 13 10:54:56 maria-GP63-Leopard-8RD docker-compose[20484]: Creating zigbee2mqtt ...
may 13 10:54:56 maria-GP63-Leopard-8RD docker-compose[20484]: Creating influxdb    ...
may 13 10:55:07 maria-GP63-Leopard-8RD docker-compose[20484]: [153B blob data]
may 13 10:55:14 maria-GP63-Leopard-8RD docker-compose[20484]: [43B blob data]
may 13 10:55:14 maria-GP63-Leopard-8RD systemd[1]: Finished Service for monitoring smart sensors.
This service runs ZigBee2MQTT, Mosquitto, InfluxDB and Telegraf with docker. If you want to stop the service run the command systemctl stop shapes-monitoring-service.
Optional. When synchronizing the sensors you can rename the devices in the configuration file in the zigbee2mqtt-data folder, which is located in the /etc/compose directory. An example would be as follows:
homeassistant: true
permit_join: true
mqtt:
  base_topic: zigbee2mqtt
  server: 'mqtt://localhost'
serial:
  port: /dev/ttyUSB0
advanced:
  rtscts: false
devices:
  '0x00158d00047b5824':
    friendly_name: temperature_humidity_living-room/SENSOR
  '0x00158d0002520b26':
    friendly_name: door_window_living-room/SENSOR
  '0x00158d0002567d32':
    friendly_name: motion_living-room/SENSOR
  '0x00158d0003cc4e70':
    friendly_name: motion_bedroom/SENSOR
  '0x00158d000395b3a6':
    friendly_name: motion_kitchen/SENSOR
  '0x00158d00047b835a':
    friendly_name: temperature_humidity_kitchen/SENSOR
  '0x00158d000290b6d5':
    friendly_name: door_window_bedroom/SENSOR
In addition, this package automates the provision of Grafana with data stored in InfluxDB. To create the correct files, shapes-monitoring-service must know the database connection parameters, so we must edit its configuration file with sudo shapes-monitoring-service -e. A configuration can be:
DBNAME=zigbee2mqtt
DBUSER=telegraf
DBPASSWORD=telegraf
DBHOST=localhost
DBPORT=8086
Then, execute the following command to create the database in InfluxDB:
pi@raspberrypi:~$ sudo shapes-monitoring -u
Connected to http://localhost:8086 version 1.8.5
    InfluxDB shell version: 1.6.4
    > create database zigbee2mqtt
    > use zigbee2mqtt
    Using database zigbee2mqtt
    > create user telegraf with password 'telegraf' with all privileges
    > grant all on zigbee2mqtt to telegraf
    > exit
Database checked!
Done updating!
This will provision our local Grafana instance. If you check http://localhost:3000 you will see the Grafana UI, and following on the side menu Dashboards > Manage we can see our provisioned dashboards:
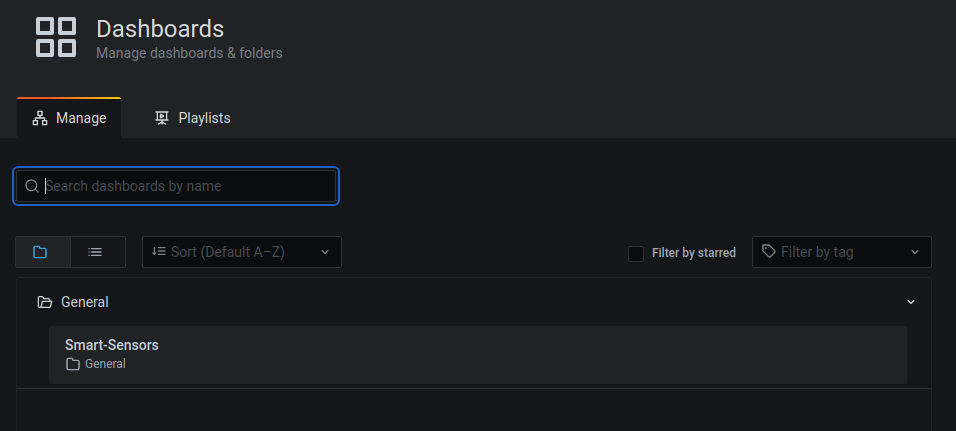
To see what files where provisioned and the generated dashboards information use:
pi@raspberrypi:~$ sudo shapes-monitoring -s
INFO: Datasource provider file at /etc/grafana/provisioning/datasources/shapes-monitoring-datasource.yaml
INFO: Dashboard provider file at /etc/grafana/provisioning/dashboards/shapes-monitoring-dashboard.yaml
INFO: Found dashboard definition at /var/lib/grafana/dashboards/shapes-monitoring-dashboard.json:
INFO: 	Name: smart-sensors
INFO: 	UID: fFBmCCrMz
INFO: Available panels:
INFO: 	ID: 1	Description: Bathroom sensors
INFO: 	ID: 2	Description: Living room sensors
INFO: 	ID: 3	Description: Bedroom sensors
INFO: 	ID: 4	Description: Kitchen sensors
NOTE: If you want grafana to be started on boot, execute sudo systemctl enable grafana-server.service.
Once the service shapes-monitoring-service is started and the database has been configured, you have to run the shapes-monitoring command. This command executes an mqtt client that transforms the values true and false into an 1 and 0 for the motion and door and window sensors before storing them in the database. The output of this command would look like this:
pi@raspberrypi:~$ shapes-monitoring-client
Connected to MQTT Broker localhost:1883 with return code 0!
Received {"battery":100,"contact":true,"linkquality":162,"voltage":3005} from zigbee2mqtt/door_window_living-room/SENSOR topic!
Sensor data: {'battery': 100, 'contact': 1, 'linkquality': 162, 'voltage': 3005}
Sensor data published to zigbee2mqtt/smart-sensors/living-room topic!

Received {"battery":100,"contact":true,"linkquality":158,"voltage":3005} from zigbee2mqtt/door_window_bedroom/SENSOR topic!
Sensor data: {'battery': 100, 'contact': 0, 'linkquality': 158, 'voltage': 3005}
Sensor data published to zigbee2mqtt/smart-sensors/bedroom topic!

Received {"battery":100,"humidity":52.09,"linkquality":129,"pressure":947.6,"temperature":25.24, "voltage":3015} from zigbee2mqtt/temperature_humidity_living-room/SENSOR topic!
Sensor data published to zigbee2mqtt/smart-sensors/living-room topic!
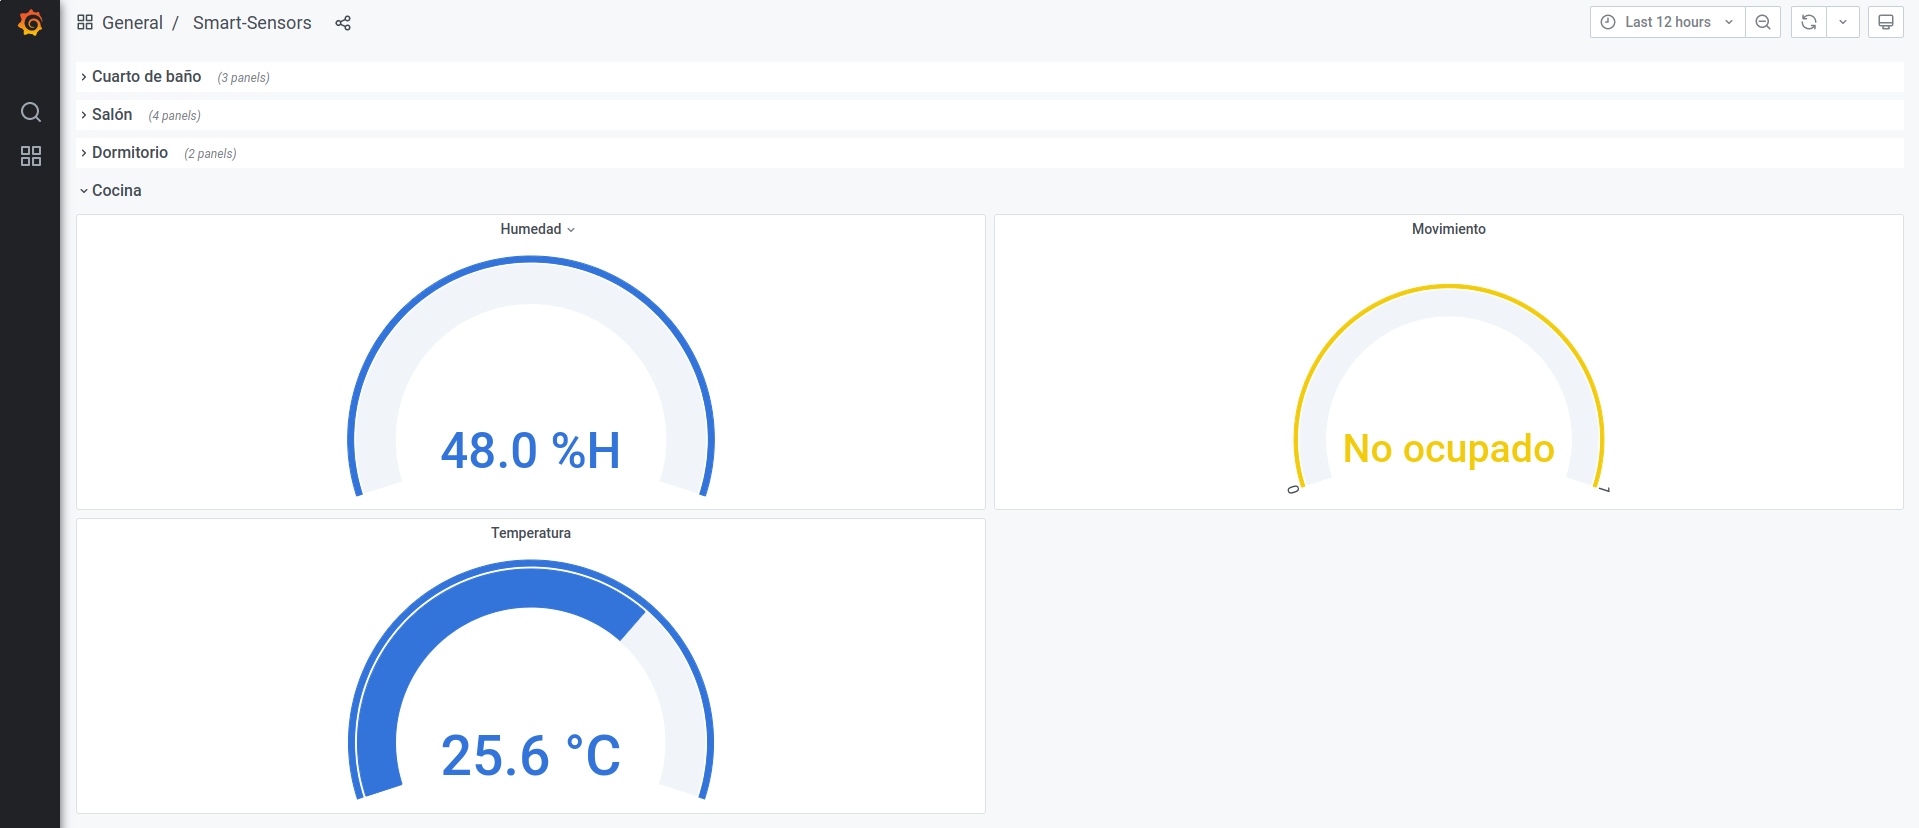
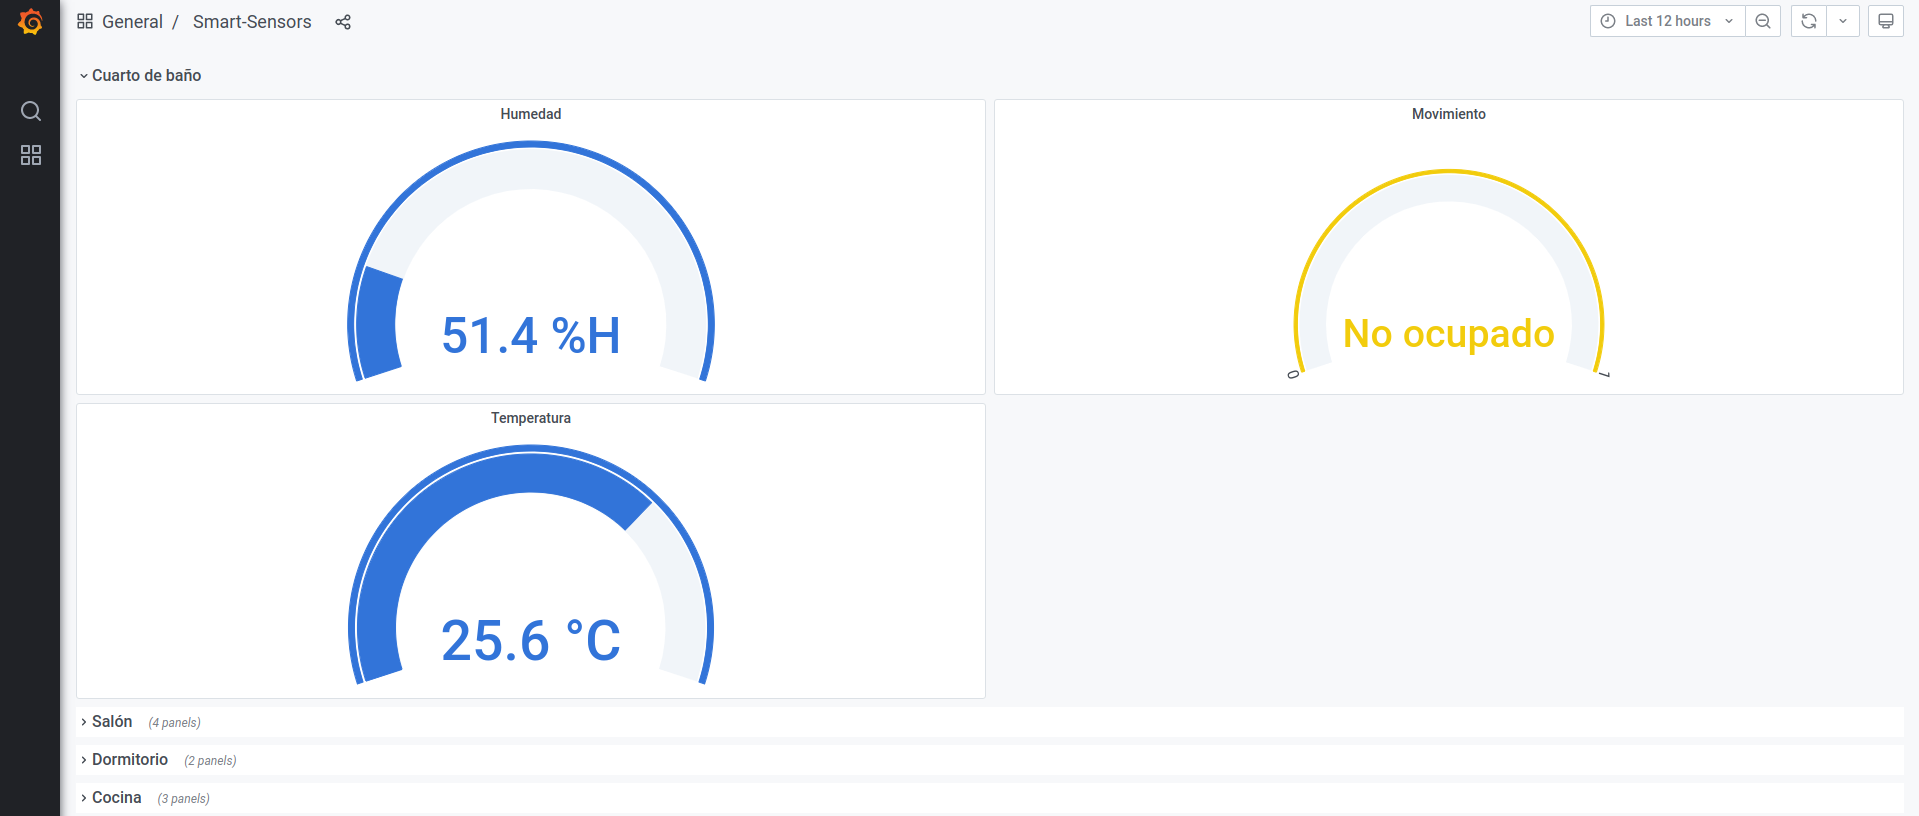
To view the data transmitted by the sensors go to the Smart Sensors dashboard and you will see something similar to the following image:
-
Bathroom sensors
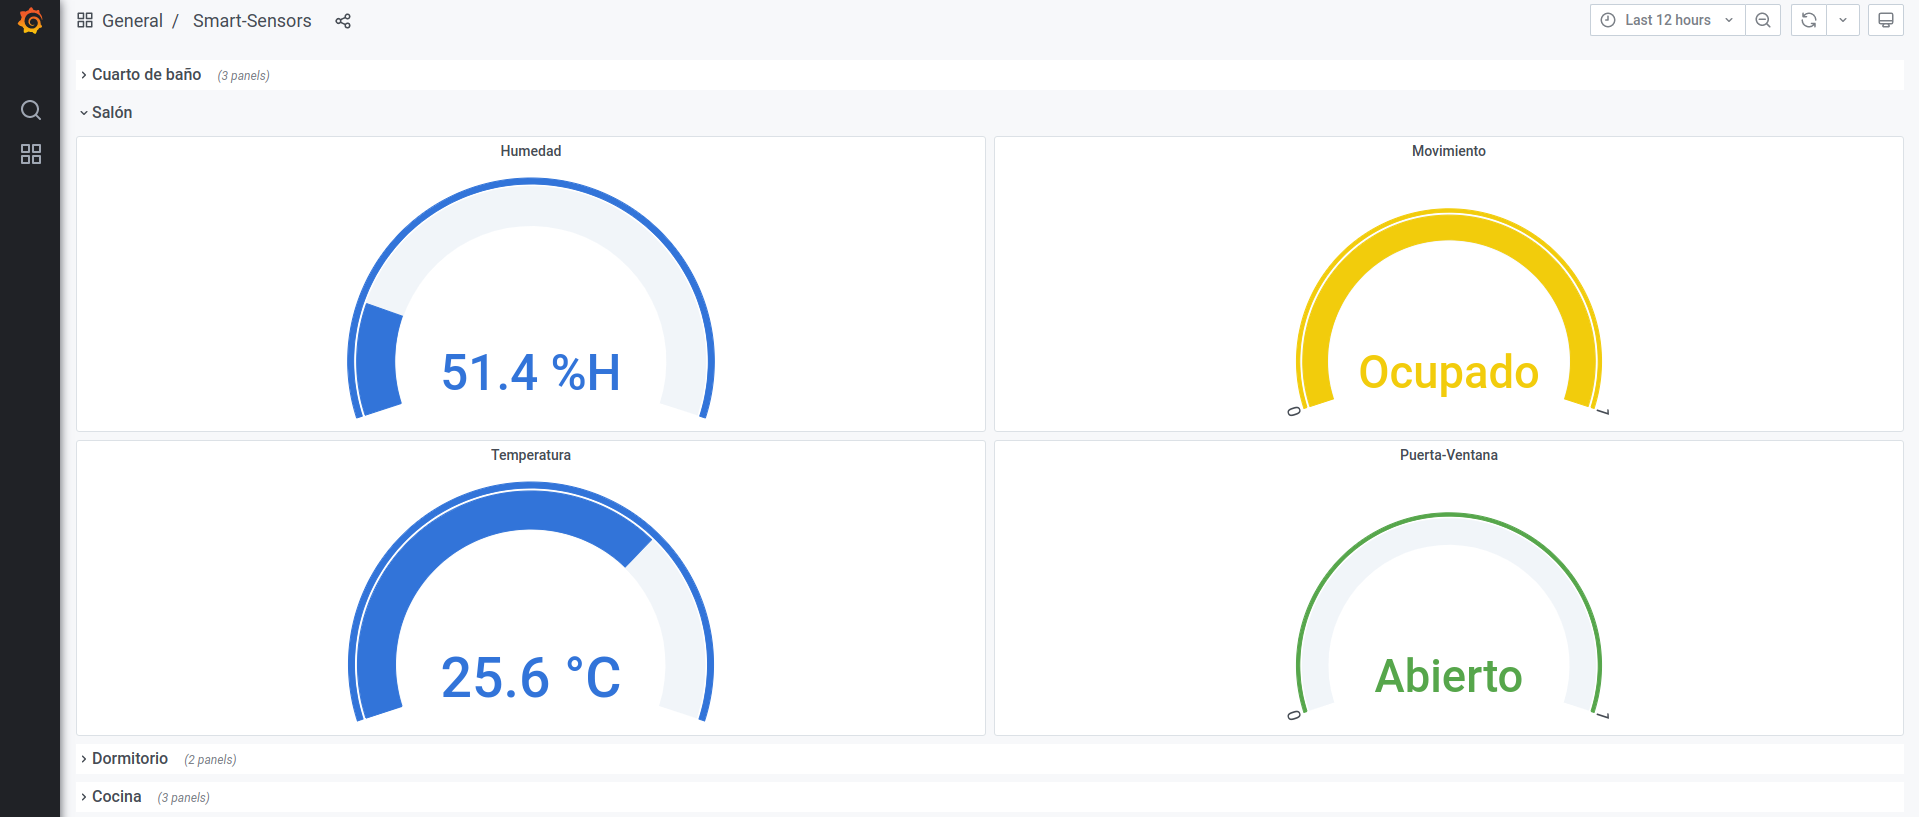
-
Living-room sensors
-
Bedroom sensors
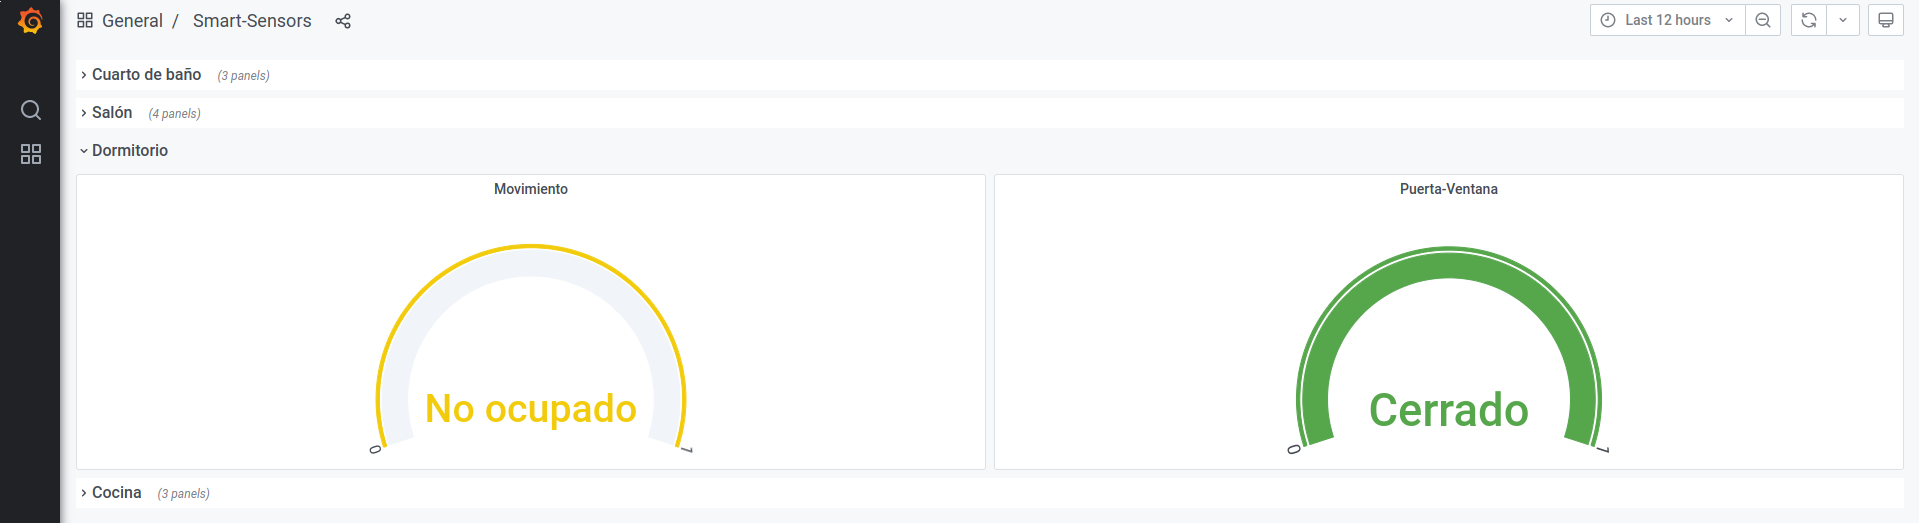
-
Kitchen sensors